Using the Flutter inspector
What is it?
The Flutter widget inspector is a powerful tool for visualizing and exploring Flutter widget trees. The Flutter framework uses widgets as the core building block for anything from controls (such as text, buttons, and toggles), to layout (such as centering, padding, rows, and columns). The inspector helps you visualize and explore Flutter widget trees, and can be used for the following:
- understanding existing layouts
- diagnosing layout issues
Get started
To debug a layout issue, run the app in debug mode and open the inspector by clicking the Flutter Inspector tab on the DevTools toolbar.
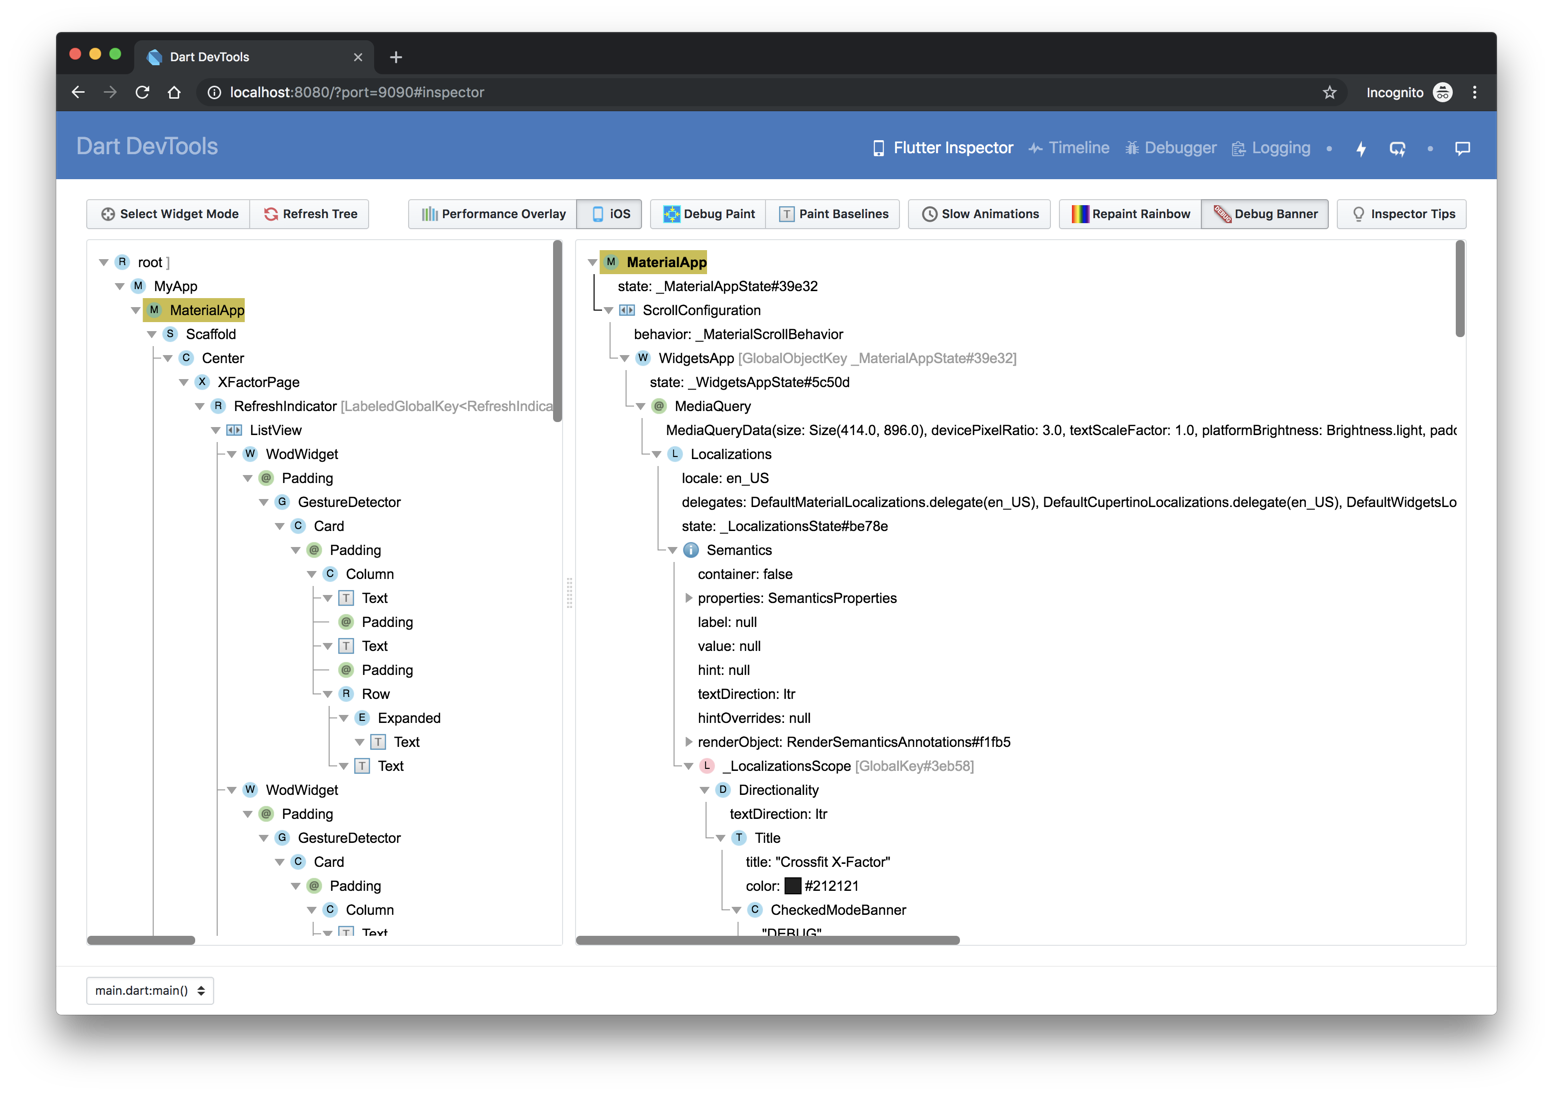
Debugging layout issues visually
The following is a guide to the features available in the inspector’s toolbar. When space is limited, the icon is used as the visual version of the label.
-
Select widget mode

-
Enable this button in order to select a widget on the device to inspect it. For more information, see Inspecting a widget.
-
Refresh tree

- Reload the current widget info.
-
Performance Overlay

-
Toggle display of performance graphs for the GPU & CPU threads. For more information on interpreting these graphs, see The performance overlay in Flutter performance profiling.
-
iOS

- Toggle rendering and gesture behaviors between Android and iOS.
-
Debug Paint

- Add visual debugging hints to the rendering that display borders, padding, alignment, and spacers.
-
Paint Baselines

- Cause each RenderBox to paint a line at each of its text baselines.
-
Slow Animations

- Slow down animations to enable visual inspection.
-
Repaint Rainbow

- Shows rotating colors on layers when repainting.
-
Debug Mode Banner

- Toggles display of the debug banner even when running a debug build.
Inspecting a widget
You can browse the interactive widget tree to view nearby widgets and see their field values.
To locate individual UI elements in the widget tree, click the Select Widget Mode button in the toolbar. This puts the app on the device into a “widget select” mode. Click any widget in the app’s UI; this selects the widget on the app’s screen, and scrolls the widget tree to the corresponding node. Toggle the Select Widget Mode button again to exit widget select mode.
When debugging layout issues, the key fields to look at are the
size and constraints fields. The constraints flow down the tree,
and the sizes flow back up.
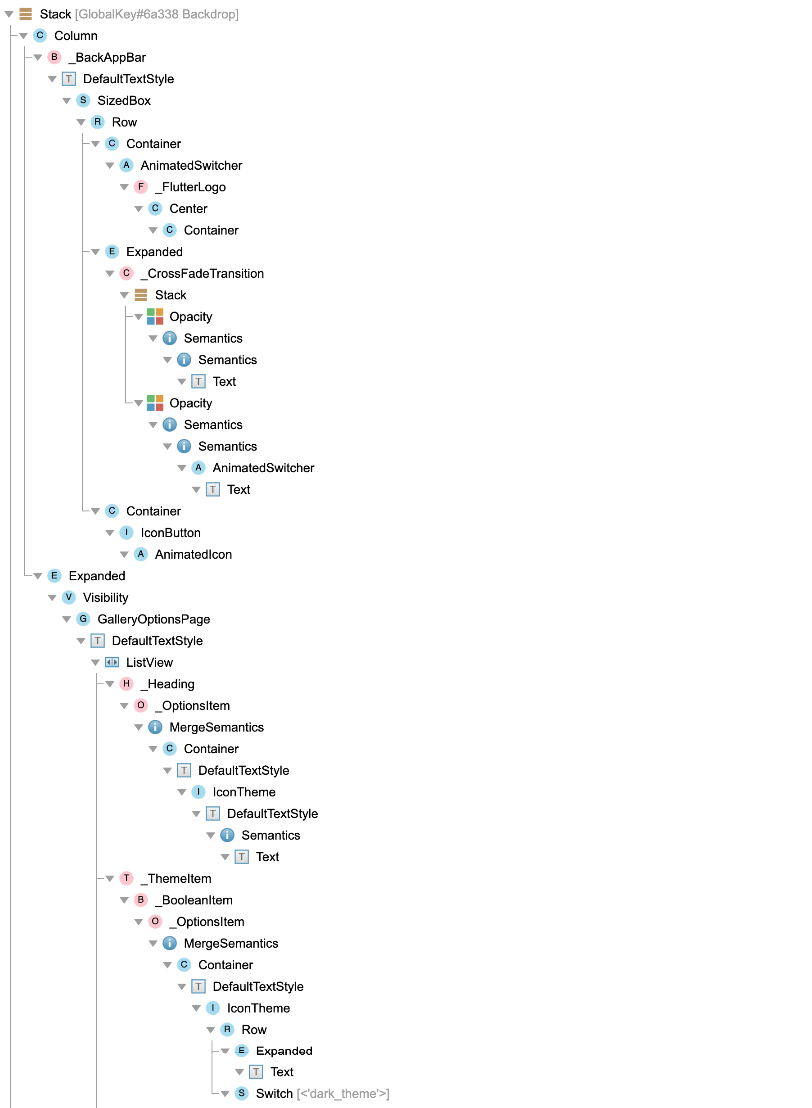
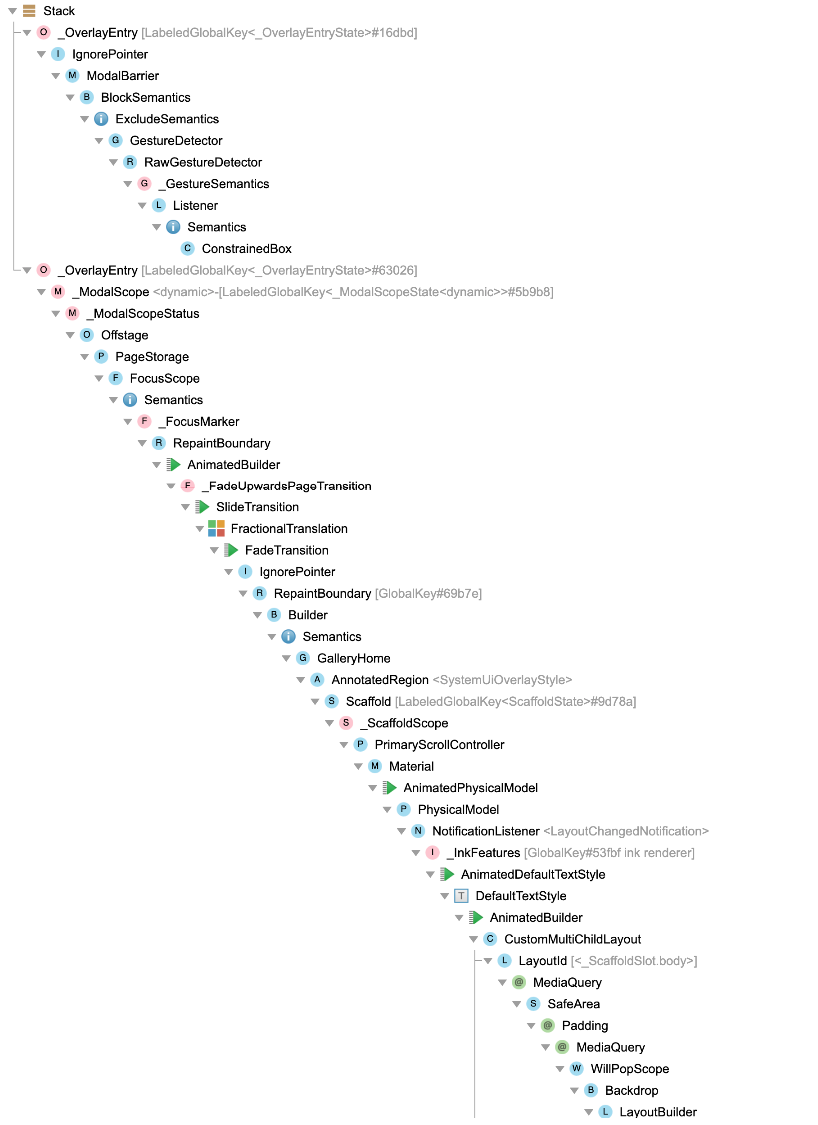
Track widget creation
Part of the functionality of the Flutter inspector is based on instrumenting the application code in order to better understand the source locations where widgets are created. The source instrumentation allows the Flutter inspector to present the widget tree in a manner similar to how the UI was defined in your source code. Without it, the tree of nodes in the widget tree are much deeper, and it can be more difficult to understand how the runtime widget hierarchy corresponds to your application’s UI.
When launching an application from an IDE, the source
instrumentation happens by default. For command line launches,
you need to opt-in to the source instrumentation. To do this,
run the app with the --track-widget-creation flag:
flutter run --track-widget-creation
If you launch without the flag, you can still use the inspector—you’ll see an inline, dismissable reminder message about using the source instrumentation flag.
Here are examples of what your widget tree might look like with and without track widget creation enabled.
Track widget creation enabled (recommended):
Track widget creation disabled (not recommended):
Other resources
For a demonstration of what’s generally possible with the inspector, see the DartConf 2018 talk demonstrating the IntelliJ version of the Flutter inspector.