Using the Memory view
What is it?
Allocated Dart objects created using a class constructor
(for example, by using new MyClass() or MyClass())
live in a portion of memory called the heap.
DevTools Memory pane lets you peek at how an isolate is using memory at a given moment. This pane, using Snapshot and Reset, can display accumulator counts. The accumulators can be used to study the rate of memory allocations, if you suspect your application is leaking memory or has other bugs relating to memory allocation.
Memory profiling consists of four parts, each increasing in granularity:
- Memory overview chart
- Event timeline
- Snapshot classes
- Class instances
Memory anatomy
Use a timeseries graph to visualize the state of the Flutter memory at successive intervals of time. Each data point on the chart corresponds to the timestamp (x-axis) of measured quantities (y-axis) of the heap, for example, usage, capacity, external, garbage collection, and resident set size.
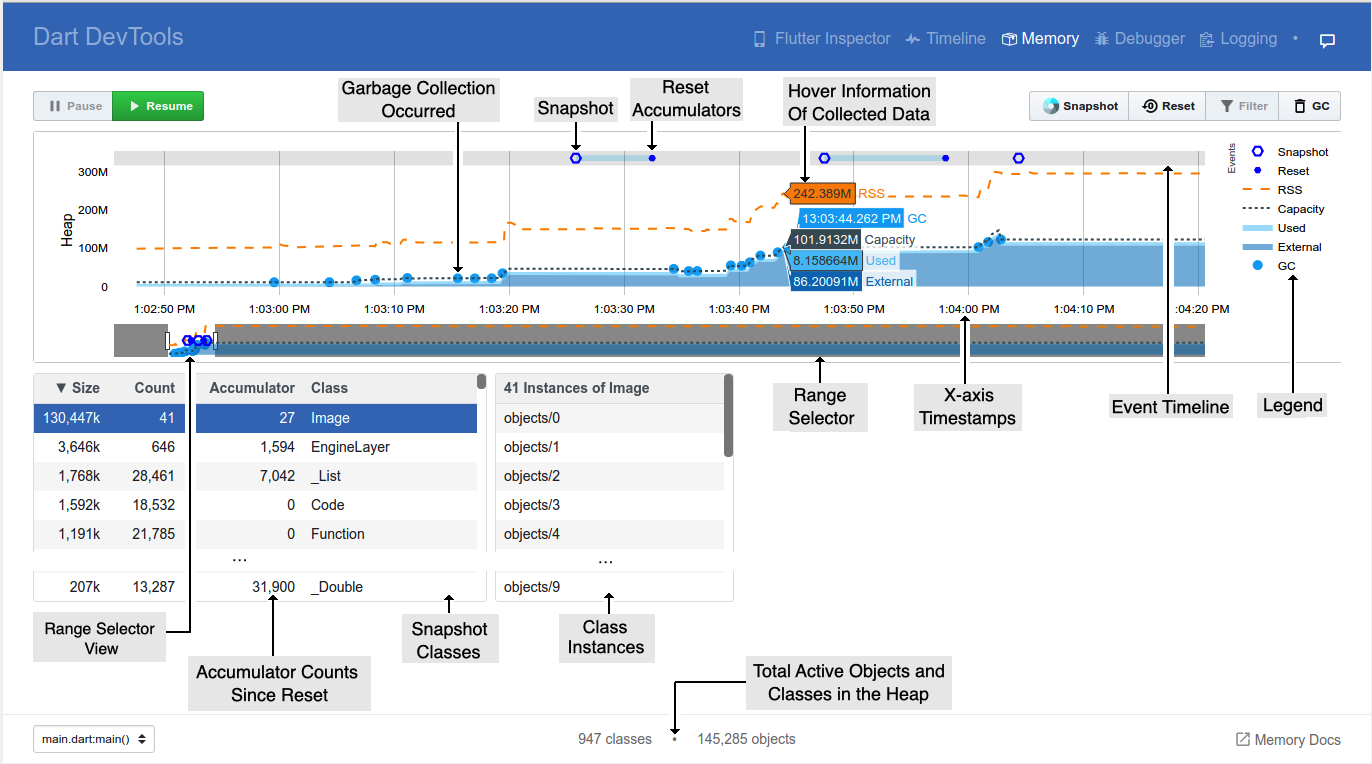
- Legend
- All collected measurements regarding the memory. Clicking a legend name hides or shows that data.
- Range selector
- All memory data collected (timeseries). The left-most or first time/data (memory information), in the selector is when the application was launched. The right-most or last time/data is the continual memory information being received (live) until the application is stopped.
- Range selector view
- Detailed view of the data collected for this timeseries range (non-gray area).
- X-axis timestamp
- Time of the collected memory information (capacity, used, external, RSS (resident set size), and GC (garbage collection).
- Hover information of collected data
- At a particular time (x-axis) the detailed collected memory data.
- Garbage collection occurred
- Compaction of the heap occurred.
- Event timeline
- When a user action occurred (such as the Snapshot or Reset button being clicked).
- Snapshot
-
Display a table of current active memory objects (see Snapshot classes).
- Reset accumulator
-
Reset values, to zero, under the Accumulator column in the Snapshot classes table.
- Filtering classes
- PENDING
- Snapshot classes
- Clicking the Snapshot button (top right area) displays a table of current memory objects. The memory objects can be sorted by class name, size, allocated instances, and so on.
- Accumulator counts since reset
- Clicking the Reset button (top right area) resets the accumulated instances count. Clicking Snapshot after a reset displays the number of new instances allocated since last reset. This is useful for finding memory leaks.
- Class instances
- Clicking a class in the Snapshot class table displays the number of active instances for that class.
- Inspecting contents of an instance
- PENDING
- Total active objects and classes in the heap
- Total classes allocated in the heap and total objects (instances) in the heap.
- Capacity
- Current capacity of the heap.
- GC
-
GC (garbage collection) has occurred. For more information on how Dart performs garbage collection, see Don’t Fear the Garbage Collector.
- Used
- Objects (Dart objects) in the heap.
- External
-
Memory that is not in the Dart heap but is still part of the total memory footprint. Objects in external memory would be native objects (for example, from a memory read from a file, or a decoded image). The native objects are exposed to the Dart VM from the native OS (such as Android, Linux, Windows, iOS) using a Dart embedder. The embedder creates a Dart wrapper with a finalizer, allowing Dart code to communicate with these native resources. Flutter has an embedder for Android and iOS. For more information, see Dart on the Server or Custom Flutter Engine Embedders.
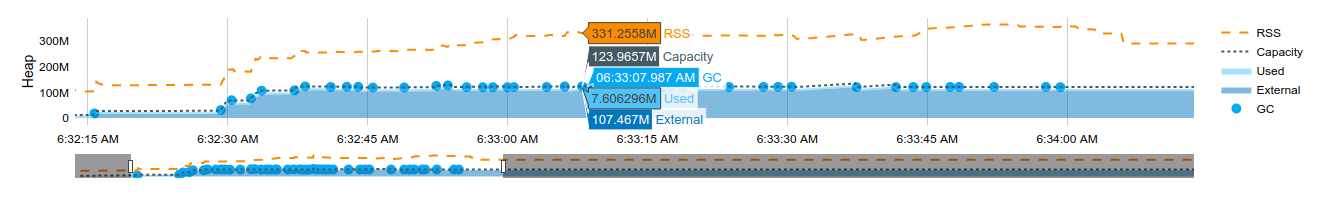
To view RSS (resident set size), click the name of the RSS located in the legend.
- The resident set size displays the amount of memory to a process. It doesn’t include memory that is swapped out. It includes memory from shared libraries that are loaded, as well as all stack and heap memory.
For more information, see Dart VM internals.
Event timeline
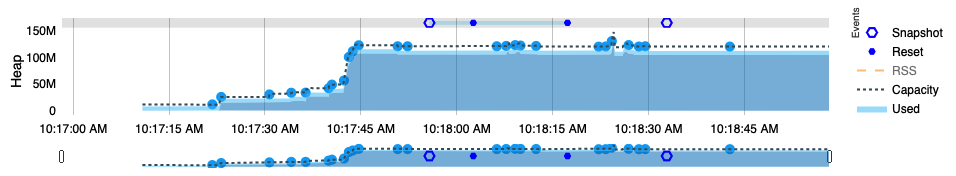
This chart displays DevTools events (such as Snapshot and Reset button clicks) in relation to the memory chart timeline. Hovering over the markers in the Event timeline displays the time when the event occurred. This helps identify when a memory leak might have occurred in the timeline (x-axis).

Clicking the Snapshot button shows the current state of the heap with regard to all active classes and their instances. When the Reset button is pressed, the accumulator for all classes resets to zero. The reset is temporally tied, using a faint blue horizontal bar, to the previous snapshot. Clicking the Reset button again resets the accumulators since the last reset and temporally ties the latest reset to the previous reset.
Snapshot classes
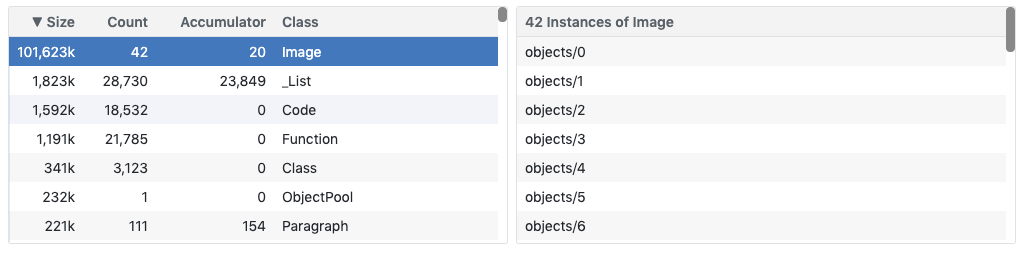
This pane shows classes allocated in the heap, total instances, total bytes allocated, and an accumulator of allocations since the last reset.
- Size
- Total amount of memory used by current objects in the heap.
- Count
- Total number of current objects in the heap.
- Accumulator
- Total number of objects in the heap since the last reset.
- Class
- An aggregate of the objects allocated to this class. Clicking a class name displays a list of class instances.
Class instances
Displays a list of class instances by their handle name. [PENDING: add a link to inspecting data values.]
Memory actions
Liveness of the memory overview chart
- Pause
- Pause the memory overview chart to allow inspecting the currently plotted data. Incoming memory data is still received; notice the Range selector continues to grow to the right.
- Resume
- The memory overview chart is live and displaying the current time and the latest memory data received.
Managing the objects and statistics in the heap
- Snapshot
- Returns the list of active classes in the heap. The Accumulator column displays the number of allocated objects since the previous reset.
- Reset
- Zeroes out the Accumulator column in the Snapshot classes table, and refreshes the displayed data.
- Filter
- The Snapshot classes table displays classes from the set of packages selected.
- GC
- Initiates a garbage collection.
Glossary of VM terms
Here are some computer science concepts that will help you better understand how your application uses memory.
- Garbage collection (GC)
- GC is the process of searching the heap to locate, and reclaim, regions of "dead" memory—memory that is no longer being used by an application. This process allows the memory to be re-used and minimizes the risk of an application running out of memory, causing it to crash. Garbage collection is performed automatically by the Dart VM. In DevTools, you can perform garbage collection on demand by clicking the GC button.
- Heap
- Dart objects that are dynamically allocated live in a portion of memory called the heap. An object allocated from the heap is freed (eligible for garbage collection) when nothing points to it, or when the application terminates. When nothing points to an object, it is considered to be dead. When an object is pointed to by another object, it is live.
- Isolates
-
Dart supports concurrent execution by way of isolates, which you can think of processes without the overhead. Each isolate has its own memory and code that can’t be affected by any other isolate. For more information, see The Event Loop and Dart.
- Memory leak
- A memory leak occurs when an object is live (meaning that another object points to it), but it is not being used (so it shouldn't have amy references from other objects). Such an object can't be garbage collected, so it takes up space in the heap and contributes to memory fragmentation. Memory leaks put unnecessary pressure on the VM and can be difficult to debug.
- Virtual machine (VM)
- The Dart virtual machine is a piece of software that directly executes Dart code.
Memory overview chart
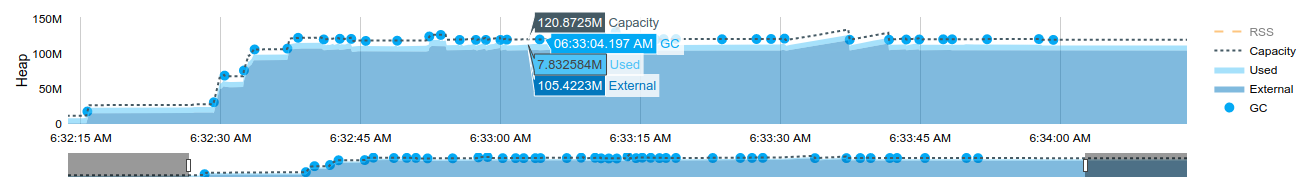
This chart is a timeseries graph to help visualize the state of the heap at various points in time.
The chart’s x-axis is a timeline of events (timeseries). In other words, it shows the polled state of the memory every 500 ms. This helps give a live appearance on the state of the memory as the application is running. The quantities plotted on the y-axis are (from top to bottom):